


A data product owner is a pivotal member of an agile team. By representing the end user’s best interests and managing the backlog, they ensure that strides are made towards the identified product goal. Product owners are accountable for maximizing user value through the efforts of the individual contributors. What does this mean? It means gathering user requirements, coordinating individual contributors, addressing blockers and making sure that the product built is valuable to the business.
by TJ Quan & Sabrina Paparo
Previously, we dug into measuring the success of data professionals and data team managers, but we’re still missing a role. Data product owners are an increasingly common addition to data teams and provide important alignment value. This value is distinct from but complementary to that of the data team manager. This post will define exactly what a data product owner is and propose a framework for measuring their success.
Identifying the value of a data product owner
Data can both power products and serve as a product in its own right. Data professionals have written about data as a product versus as a service, how to run your data team as a product team, and more. A product orientation helps shift data teams from responding to a backlog of requests to building a data platform that serves those requests in efficient and maintainable ways. But within a data team, who advocates for the needs of data consumers?
The product owner’s importance is well explained by two stances they take: The customer representative and the collaborator.
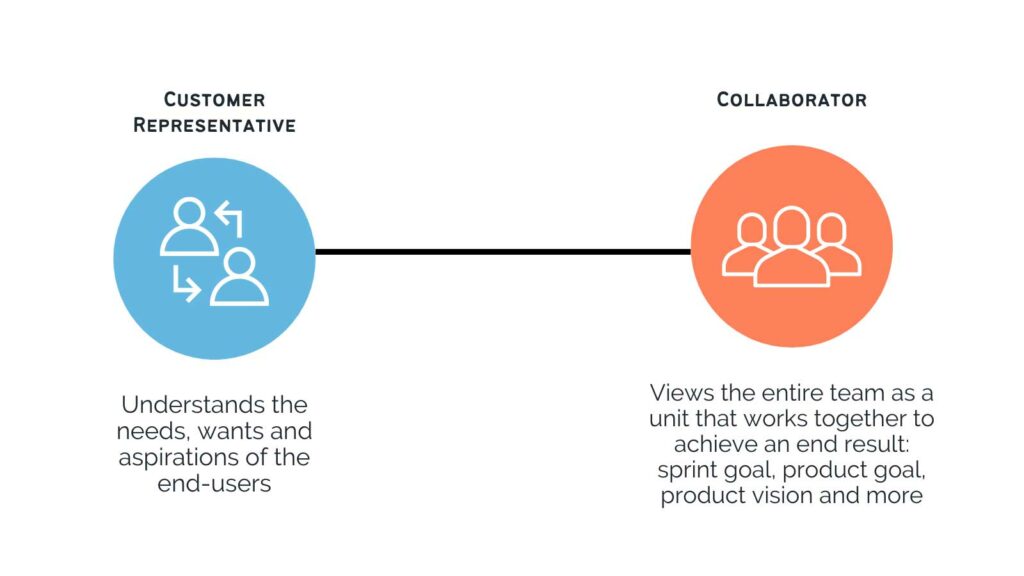
As the customer representative, they must understand the needs, wants and aspirations of the end-users. Understanding the why, or the problem, allows the team to build a product that will alleviate the current frustrations. For that reason, the product owner drives the conversation with key business stakeholders. Oftentimes, stakeholders will request a specific output rather than a desired outcome. It is the product owner’s responsibility to identify the user’s desired outcome, and leave the exact solution to the developers. Blindly following the user’s prescription can lead to missteps and technical debt in the long-term. The product owner is there to ask the right questions to expose the gap in satisfaction and find an area of improvement: What drives revenue? What issues are the stakeholders coming across daily? What features can alleviate the current issues? Understanding the business goes a long way.
As the collaborator, they view the entire team as a unit that works together to achieve an end result: sprint goal, product goal, product vision and more. Keeping the team focused on that end goal increases engagement and motivation of the entire team, as they are not pulled in too many directions. As any great collaborator, they practice active listening, they are appreciative and sincere, and most importantly, they are transparent and open. These are qualities that help build trust within the team and with the stakeholders.
The difference between product owners, product managers, and project managers
The similarity of these names often causes confusion. In the simplest terms, there is a division between products and projects, and between ownership and management.
The first difference, between products and projects, is a difference in approach and methodology. While a project manager is a more traditional role that uses the waterfall approach, the product owner follows the Agile Framework, commonly using the Scrum or Kanban methodologies. Waterfall is a linear-sequential life cycle model that is managed top-down and is planned entirely upfront (i.e. predictive approach). On the other hand, agile takes an incremental/adaptive approach on achieving the best end objective through short cycles to inspect and adapt frequently. While both approaches have their own strengths, agile is great for mitigating risk and uncertainty in complex projects that are open-ended and continuously evolve. By contrast, waterfall is best suited to projects with very specific, well-understood deliverables and timelines.
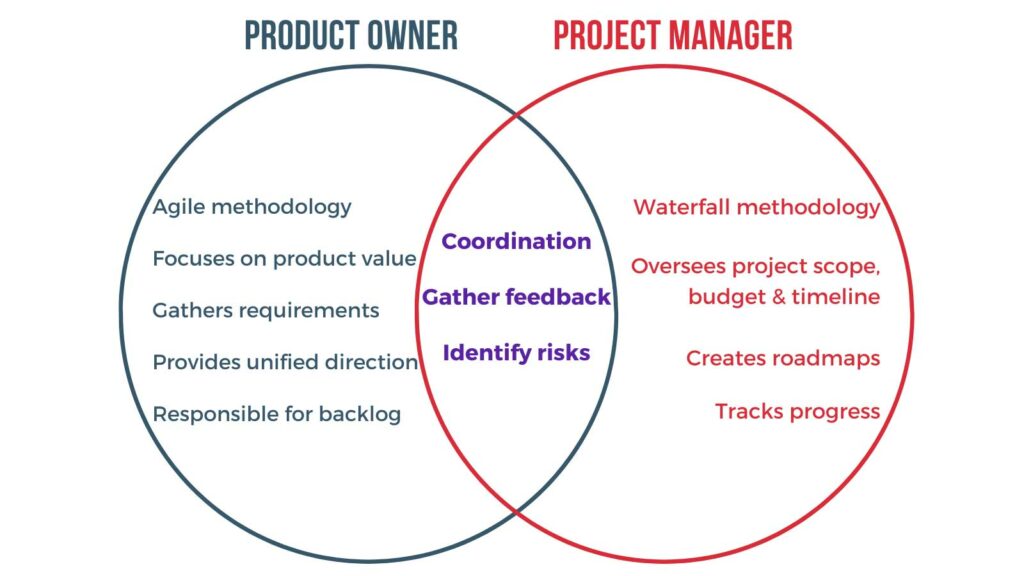
The second difference, between owners and managers, is a difference in scope and perspective. While a product owner is a tactical scrum role, a product manager takes a broader and more strategic approach. The owner is responsible for the backlog and for representing the user’s interests in each backlog item, while the manager is responsible for the product vision and ultimate user satisfaction with the product. Many organizations combine the product owner and product manager roles; others may product manage by committee. Regardless, product ownership is a necessary function.
Product owner’s responsibilities in a data team
Suppose Montreal Analytics spins off a second business to sell poutine, a dish from Quebec consisting of french fries, cheese curds and gravy, around the world. It’s an ecommerce platform called the Poutine Shop where you can buy not only poutine, but also sandwiches, drinks and other products. The Poutine Shop is interested in using the business’ data to improve the customer experience.
To start, the Poutine Shop determined the top priority product goal: the operations team is interested in improving the efficiency of its fulfillment operations. They did the product management work together and determined that this goal has the highest priority and that they need the data team’s help to deliver on this goal.
Given this goal, the data product owner works with its users, the operations team, to define and prioritize the backlog of stories. The operations team needs a dashboard that tracks service level agreements and highlights fulfillment delays, so that they can adjust staffing schedules and reallocate resources to address acute fulfillment problems. The product owner creates an epic for this project, and begins refining its stories, tasks, and subtasks. In refining this project, the product owner can now keep in mind the primary objective: How the data platform can help improve the efficiency of the organization’s fulfillment operations.
Now, with a backlog in place, the product owner becomes an ambassador for the operations team: prioritizing tasks appropriately, and clarifying stories when there is any ambiguity about the goal.
Another example: suppose in the previous sprint, the data team configured Fivetran to load in all of the Shopify orders for the Poutine Shop, and now in this sprint, they need to model this data with dbt before it can be visualized in the BI tool. While working on the modeling task, the team realizes that the volume of the orders data is larger than they initially anticipated, that their standard modeling approach would not be the most efficient from a cost management perspective, and that the story should be expanded to include the configuration of incremental transformation logic. This is where the product owner plays a pivotal role: given the new information, they can ask if there is enough information to know whether or not this change is needed and if needed, if this solution is appropriate. If it is needed, the product owner can now determine if it’s needed immediately to deliver on the product goal, or if this task is in support of a separate and secondary product goal and should thus be deprioritized. Additionally, if the solution is not entirely appropriate, the product owner can recommend a spike or some other investigation to better address this issue. Ultimately, the product owner is here to help determine what is needed and to advocate for the relative priorities of those needs. In this example, they may determine that the solution is appropriate, but not high enough priority, and thus will be put into the backlog rather than into the sprint. The product owner has now added a meaningful task to the backlog while maintaining focus on the primary product goal.
The metrics of success for product owners
Now that we better understand the role of the product owner, let’s discuss measuring their success. To start, an organization can refer to the Evidence-Based Management Guide. The EBM guide focuses on 4 Key Value Areas (KVAs) which can be considered throughout the life of all user products.
| Key value area | Definition |
|---|---|
| Current value (CV) | Value currently delivered by organization |
| Unrealized value (UV) | Potential value that could be achieved |
| Time-to-market (T2M) | Time it takes to deliver value |
| Ability to innovate (A2I) | Effectiveness at improving value |
It is a product owner’s responsibility to measure the value that the organization’s data team and platform are currently delivering (CV), and explore any user satisfaction gaps that indicate additional potential value (UV). Large satisfaction gaps indicate opportunities for investment.
Consider the following example: a company’s data and reporting stack is built on legacy technology: the users are familiar with the system, it is effective for their current needs and it allows them to continue business as usual. However, it is outdated, it lacks flexibility, and it is not cost effective nor scalable. Current value (CV) is low and unrealized value (UV) is high. With a high UV, we can increase CV through the benefits obtained by the data tools in the modern data stack.
The product owner can help the team implement a data ingestion tool like Fivetran, saving time on manual tasks and increasing the trustworthiness of data. Fivetran then eliminates the need for manual extraction and loading of data by continuously synchronizing data from source to warehouse. This implementation increases CV and capitalizes on the high UV; it could also increase T2M and A2I by removing manual work.
| Effect | Description |
|---|---|
| Curent value (CV) – WILL INCREASE | Improved cost efficiency, scalability, flexibility and security |
| Unrealized value (UV) – WILL DECREASE | Reducing the user satisfaction gap – difference between desired experience & current experience will decrease |
| Time-to-market (T2M) – WILL INCREASE | Ability to ingest data into the warehouse more quickly |
| Ability to innovate (A2I) – WILL INCREASE | Removing bottlenecks from legacy stack and knowledge |
These four metrics are central to understanding a data product owner’s contribution to aligning the broader data team. Using the above value areas, we can further refine and expand our metric framework:
CV:
- Adoption rate: of all the resources being created and maintained by the data team, how many are being used, by how many unique users and how often by those users? These three variations can be represented individually to compare between resources or they can be summarized into an overall adoption metric (i.e. how many weekly active data consumers are there?).
- Trustworthiness: internal surveys can be useful for assessing trustworthiness and usefulness of data across departments; this can be achieved by sending short surveys to your team on a semi-frequent basis (e.g. quarterly).
UV:
- Downtime: what fraction of your time is downtime? Downtime is the time elapsed between a stoppage being reported and being resolved, and can be further classified by source or systems affected (e.g. user- or internal-facing).
- Failure rate: number of bugs identified divided by number of changes made to the code base (e.g. feature merges to the primary branch).
- Tech debt: what code is in need of replacement or refactor and why? Tech debt consists of all the changes you should address today, but need to delay due to other priorities. As you push these items further and further, their costs compound. Tech debt is present in data just like in software and is very important to keep in mind as you grow your team.
T2M
- Lead time: number of days between identification of bug or creation of request, and fulfillment of work for that bug or request; this time can then be grouped into ad hoc needs (i.e. bugs and minor requests) and planned needs (i.e. major requests).
- Estimation margin of error: how far off is the data team in its time estimates for tasks? Using story points or any other estimation tool, the product owner can calculate and track the data team’s margin of error from the estimate over time.
- Risk management: how often are risks properly identified and accounted for in estimates? The team may be successfully identifying some risks, such as the technical risks associated with certain solutions, while struggling with other forms of risk, such as business risk or the alignment of a given solution with the business need. If a solution is not well-aligned, that can lead to more back-and-forth and thus delays in T2M before the final feature is delivered.
A2I
- Business model alignment: there are many ways to model data. A data model that don’t accurately represent the business’s underlying model and operations will cause misinterpretation and misuse of data. Your organization’s business model features many business processes that the data model should reflect. It is difficult but highly valuable to ensure that your data models accurately represent actual business operations.
- Product vision: what is the future need for data and what tools and technologies are needed? This is an extension of business model alignment but combines more technical elements related to the state and potential of the product, or in this case, the data stack.
Conclusion
A successful data team includes many roles, and all of them play a part in your success. Depending on the size of your organization, individuals may cover multiple roles – such as an individual who is half-manager and half-PO – or roles may include many individuals – such as a team of dozens of contributors, product owners, and managers.
As your team grows, use these frameworks for data professionals, data managersand data product owners to assess your needs. With specific domains and quantifiable metrics, you’ll have a stronger foundation for planning for future growth.
Montreal Analytics is a Modern Data Stack consulting firm of 45+ people based out of North America. We help our clients on the whole data journey: pipelines, warehousing, modeling, visualization and activation, using technologies like Fivetran, Snowflake, dbt, Sigma, Looker and Census. From strategic advisory to hands-on development and enablement, our agile team can deploy greenfield data platforms, tackle complex migrations and audit & refactor entangled data models.
This article originally appeared in FiveTran. Photo by Shubham Dhage on Unsplash.