


In this column I’m going to talk to you through D-I-Y Presidential Prognostication. Why? Because there’s a U.S. presidential election coming up. No, really. It’s been on all the news. November 3rd. A Tuesday. OK, I was being ironical. Every sentient citizen is aware of the upcoming Presidential election.
But were you also aware that depending upon your political predilections you have an identifiable, preconceived notion of what your Ideal President looks like? And that Ideal can be used to predict voting patterns and the winning candidate?
Well, you do, and it can.
Like most things in your life, loyalty and engagement metrics can be used as a leading-indicator of consumer and voter behavior, so in this instance we’re going to use a simplified DIY Election Engagement formula. Some of what you do in life and in the marketplace is rationally-based, but a lot of it – in fact, most of it – is emotionally-based. Which is why real emotional engagement-based metrics identify drivers that describe how you view a category – in this case, the Office of the President of the United States – and what expectations you hold for each of those drivers, how you compare options, and, ultimately how you buy. Or in this instance, how you’ll vote.
Brands, or in this instance, candidates, that best meet expectations you hold for the category drivers are always the winners, e.g., most supporters, biggest contributions, most votes, well, you get the point.
From an election perspective, our model is highly validated. It has been used in every Presidential election since Bill Clinton ran against George H.W. Bush in 1992. It has correctly predicted the winner in every presidential election – with the exception of the 2000 race where George W. Bush beat our predicted winner, Al Gore. That’s an enviable, overall 86% success rate, even more extraordinary when you consider our model wasn’t designed to factor in Supreme Court rulings.
We called the 2016 election for Donald Trump too. We’re always able to do so because emotional engagement assessments, whether in the marketplace or voting booth, whether for pizza or politicians, measures what consumers really think, as opposed to what they say they think. But predominantly it informs us as to what they’re going to do.
I’ve talked about this before, but Brand Keys uses an indirect, psychological method of inquiry. It’s more accurate than direct Q&A, filters out guile and has a 93% test/re-test reliability. It correlates very, very highly (usually in the 0.80 to 0.901 range) with consumer or voter behavior. Bottom line? These metrics are significantly more telling and accurate than, say, just asking, “Who are you voting for?” We’ve been there and done that and we’ve all seen how that turned out!
Engagement with a Presidential candidate is measured against an Ideal. In this instance, the Ideal is made up of five drivers, that define or “describe” the Ideal. Because drivers are made up of more emotional than rational components, accurately identifying them is always problematic. Don’t panic! In this instance we’ve identified them for you.
Next, voters hold certain expectations for delivery against each driver, and we’ll talk you through that too.
The combination of the order of the drivers and expectations held for each driver identifies how voters will view the Office of the President, will compare candidates, and, ultimately, how they’ll engage with and behave positively, e.g., vote, for the candidate who best meets their expectations.
The order of electoral engagement drivers and what voters expect vary in terms of what’s important to Democrats, Independents, and Republicans, resulting in different party views, voter standards, candidate preferences, and, ultimately, voting behavior. The drivers – presented here alphabetically – can briefly be described as follows:
- Action: Does the candidate have a comprehensive, realistic, well-considered plan for solving the problems facing the country?
- Compassion: Does the candidate care about all the people?
- Perception: Does the candidate have a deep understanding of the social, economic, and cultural problems facing the country?
- Resolve: Do voters believe the candidate has the strength and leadership to guide the country?
- Trust: Is the candidate and his advisors reliable and truthful and do they communicate openly and lucidly?
It is important to note that while those five values are used to “define” the Ideal President, they vary in their order of importance and the level of expectation held for each, according to a voter’s political affiliation and/or socio-cultural beliefs.
DIY Presidential Prognostication
So, let’s see where you end up. I’ll talk you through it. We’d normally use our questionnaire and loyalty algorithm, a combination of psychological inquiry and higher-order statistical analyses, but in this case, we’ll go old school. Go get a piece of paper and pencil. Take your time, we’ll wait.
Ready? Write “1,” “2,” “3,” “4,” “5” on the left side of the paper.
Now write one of the five drivers listed above next to a number indicating how important it is to you when it comes to your Ideal President, 1 being most important and so on. You can’t ignore any of the drivers. You need all of them.
Finished? Great.
OK, below you’ll find the order of the drivers that describe the Ideal President by political affiliation. The model and insights are based on 28 years tracking voter behavior in seven Presidential elections and were updated most-recently in September 2020.
Presented by political affiliation the driver orders (as characterized by 1,520 registered voters) look like this:
Democrats see their Ideal President as follows:
- Perception
- Trust
- Resolve
- Compassion
- Action
Independents view their Ideal President as follows:
- Resolve
- Perception
- Trust
- Compassion
- Action
The Republicans’ Ideal President looks like this:
- Resolve
- Perception
- Action
- Trust
- Compassion
I don’t have to talk to you about how it’s been tumultuous times lately. So, if you want to make any adjustments after you’ve seen where your Ideal situates you according to what the survey said, feel free to make changes. Use the eraser on your pencil. We won’t tell, and you won’t lose any points. Like Churchill once noted, “Some men change their party for the sake of their principles; other their principles for the sake of their party.” But do whatever’s comfortable for you.
Ready? Now that you have the order of the drivers that define your Ideal President, you can measure individual candidates against that particular Ideal to see how well the candidate meets your expectations. Again, we’d normally do this using indirect, psychological assessments and a computer program (because different drivers make different percent-contributions to overall loyalty and engagement and the program factors that in), but in this case we’ll go retro and do it with paper and pencil.
Assume each driver of your Ideal equals 100%. How well do you think your candidate matches up to that? Write down a percentage next to each of the 5 drivers. A word of advice: not many brands meet expectations by 100%. Historically there have been pretty big gaps between what consumers desire and what brands are seen to deliver. Try to be both honest and realistic.
When you’re done, calculate an average of the five percentages and you’ll have a measure of candidate engagement.
Want to futz with your numbers? Feel free. Again, be as honest as you can. Don’t delude yourself. I mean, nobody will know, but it will be more accurate if you don’t. I don’t mean to question your veracity. It’s not entirely unknown for respondents (and voters) to do that – consciously or unconsciously. Just saying. Think about the candidate, platform, philosophy, agenda, and competitive brands. It’s not always easy to sift out preconceptions. If you want to make additional changes, go ahead and do that. We’ll wait.
OK, feel free to try this at home or talk about it with friends and family. I think it’s fair to say, no matter what your political affiliation, for too long politics seem to have been concerned with right or left, instead of right or wrong, but that’s just me talking. But getting research and elections right is of paramount concern and something everyone should be talking about.
And yeah, talk is cheap. But voting is free. So please make sure you vote.
 Robert Passikoff is founder and CEO of Brand Keys. He has received several awards for market research innovation including the prestigious Gold Ogilvy Award and is the author of 3 marketing and branding books including the best-seller, Predicting Market Success. Robert is also a frequent contributor to TheCustomer.
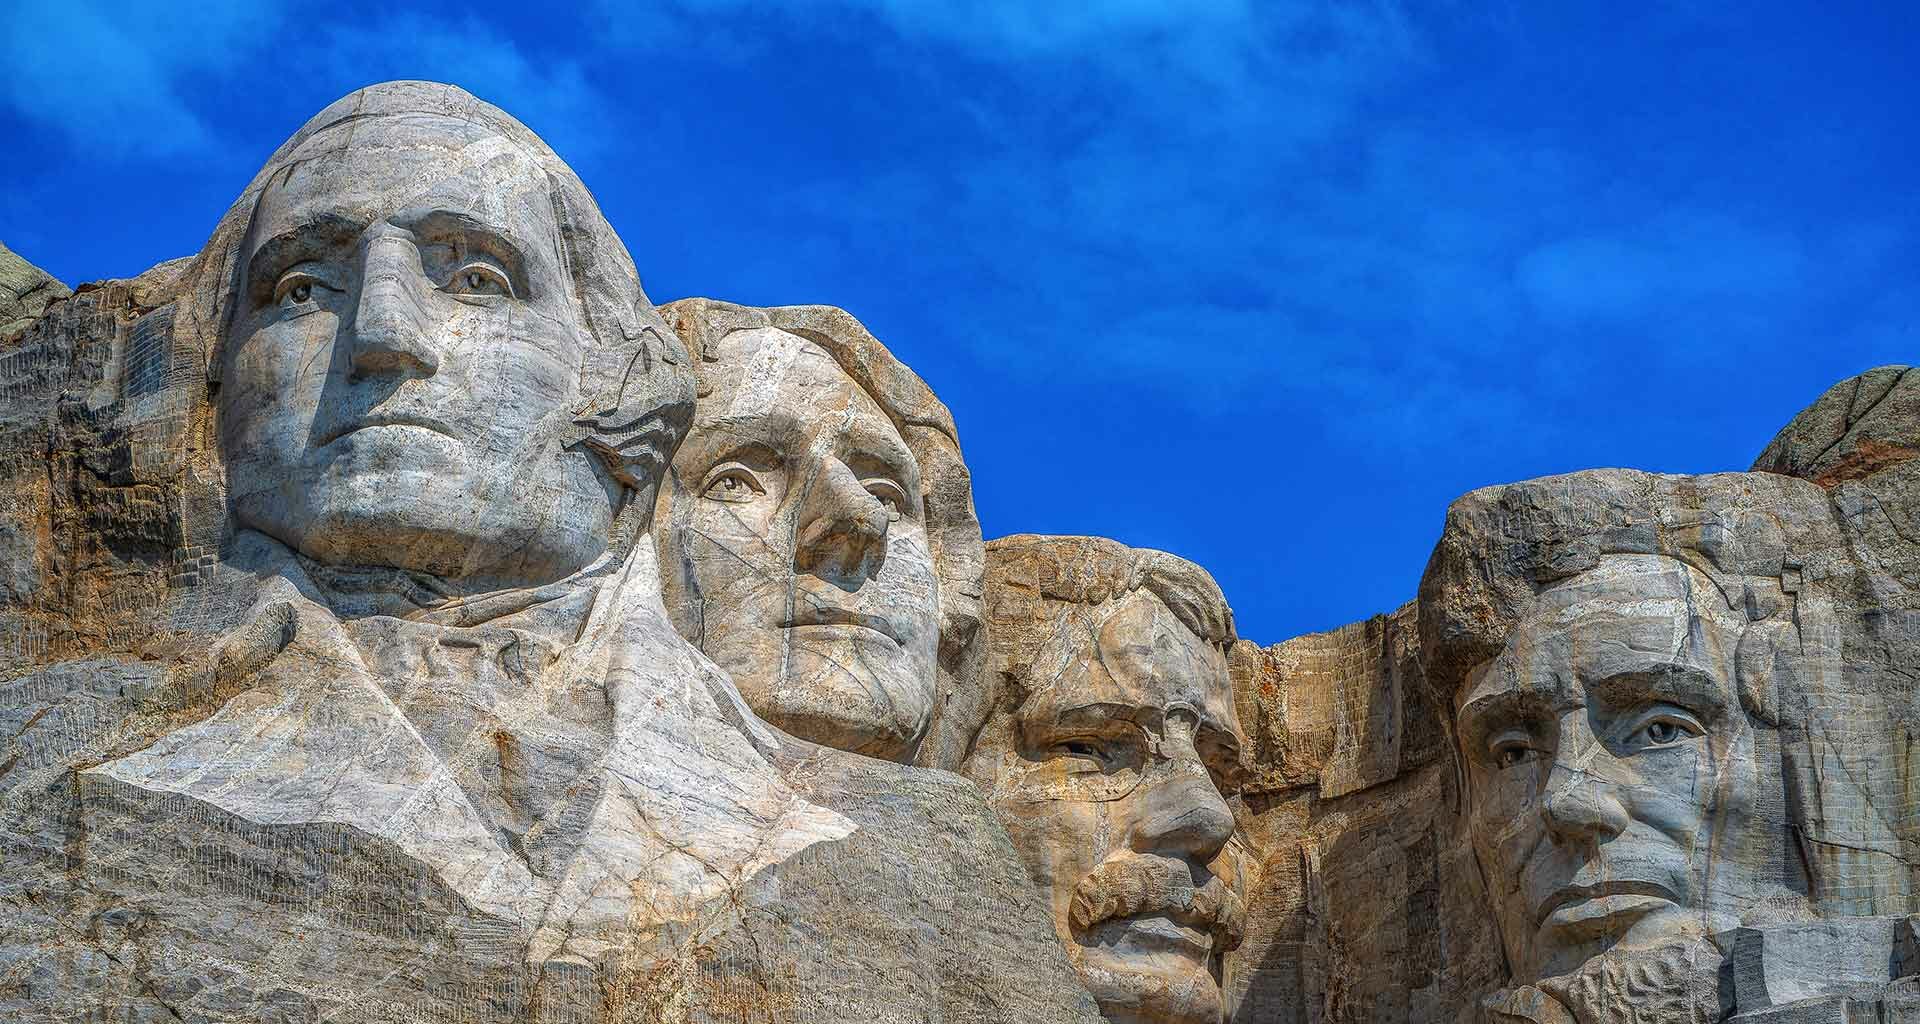
Photo by Stephen Walker on Unsplash.


2 comments