


In the age of the data flood, understanding the differences between data correlations, predictions, and causation are critical to making sound decisions and not being fooled by a fancy graph.
Nobody likes to be fooled. The majority of us want to know that they are being presented with accurate information about their topic of interest, be it market research, polling results, health related issues, financial trends, or anything else that is data related.
by Naira Musallam, PhD
In the age of the data flood, understanding the differences between data correlations, predictions, and causation are critical to making sound decisions and not being fooled by a fancy graph. Simply put, correlations mean association. It is mostly measured by a coefficient, Pearson (r), which tells you how much one variable tends to change when the other one does. Any ‘r’ can range between -1 to 1. When ‘r’ is positive, if one variable goes up the other one goes up as well. When ‘r’ is negative it means that when one variable goes up the other goes down. In short, it is about patterns in data.
Predictions on the other hand, while closely related to the concept of data correlations in the sense of looking at relationships between two variables, are a bit different. They are about using the statistical techniques of regression models to come up with the best “fit line” of being able to determine one thing by the virtue of knowing the other.
What is critical to note here is just because one variable is correlated with another, or just because one variable is able to predict the other, it does not mean that it is causing it. This is due to the fact that one may not be able to determine things like plausible alternative explanations, time priority, or lack of control.
In order to be able to determine a cause-effect relationship, one needs to rely on randomized controlled experimental designs, where ideally you expose two or more groups to different conditions and you determine the effect of those conditions (variables/ interventions) on your dependent variable (outcome).
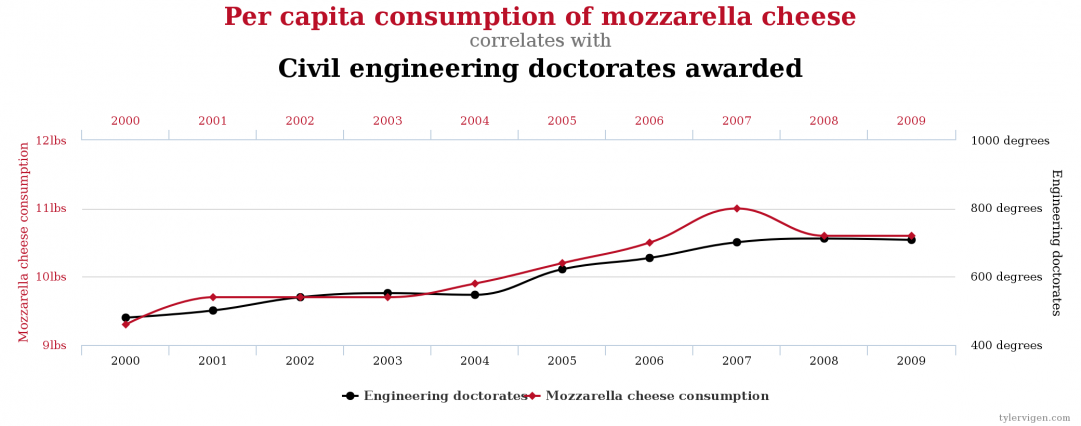
In the meantime, if you’ve ever wondered how the per capita consumption of mozzarella cheese correlates with civil engineering doctorates awarded, check out the link below. Hint: it’s always a good idea to dig deep into your data and truly understand what you’re looking at and the picture that it paints (read above!).
This article originally appeared in SightX. Photo by Piret Ilver on Unsplash.


Naira Musallam, PhD reminds me that it is vital to have a data/analytics pro on the team to help draw the right conclusions. Wrong conclusions can cost millions.